

Battle Ground, WA
Battle Ground, WA
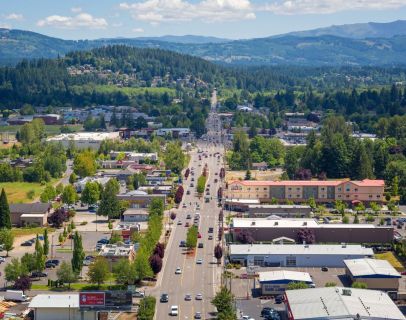
The City of Battle Ground has seen fast growth in the past decade, yielding the benefits of development: services within reach, the extension of infrastructure and the overall livability of the community. Today, Battle Ground continues to cultivate this growth by building infrastructure, fostering land development and growing a strong workforce that attracts private investors. The City and its partners are committed to enhancing business recruitment and retention. Learn more here.
Population
Population
| Population | 2000 | 2010 | 2023 | 2028 |
|---|---|---|---|---|
| Battle Ground, WA | 10,652 | 18,184 | 22,356 | 23,489 |
Source: ESRI, 2023-10-17
Population by Age
| Population | 2010 | 2023 | 2028 |
|---|---|---|---|
| 0-4 | 1,698 | 1,822 | 1,969 |
| 5-9 | 1,739 | 1,847 | 1,944 |
| 10-14 | 1,725 | 1,830 | 1,942 |
| 15-19 | 1,530 | 1,655 | 1,615 |
| 20-24 | 1,097 | 1,441 | 1,396 |
| 25-29 | 1,109 | 1,673 | 1,848 |
| 30-34 | 1,396 | 1,674 | 2,055 |
| 35-39 | 1,400 | 1,509 | 1,809 |
| 40-44 | 1,258 | 1,586 | 1,457 |
| 45-49 | 1,174 | 1,336 | 1,453 |
| 50-54 | 996 | 1,255 | 1,205 |
| 55-59 | 797 | 1,133 | 1,112 |
| 60-64 | 726 | 1,018 | 965 |
| 65-69 | 501 | 853 | 853 |
| 70-74 | 365 | 743 | 705 |
| 75-79 | 275 | 468 | 557 |
| 80-84 | 183 | 276 | 344 |
| 85+ | 215 | 237 | 260 |
| 18+ | 12,020 | 15,777 | 16,582 |
| Median Age | 31 | 33 | 33 |
Source: ESRI, 2023-10-17
Population by Race
| Battle Ground, WA | 2023 |
|---|---|
| Total | 22,356.00 |
| White Alone | 83.36 |
| Black Alone | 0.88 |
| American Indian Alone | 0.62 |
| Asian Alone | 1.87 |
| Pacific Islander Alone | 0.39 |
| Some Other Race | 3.04 |
| Two or More Races | 9.84 |
| Hispanic Origin | 9.34 |
| Diversity Index | 41.40 |
Source: ESRI, 2023-10-17
Growth Rate
| Battle Ground, WA | 2023 - 2028 |
|---|---|
| Population | 0.99% |
| Households | 1.07% |
| Families | 1.16% |
| Median Household Income | 3% |
| Per Capita Income | 3% |
Source: ESRI, 2023-10-17
Back To TopHousing
Households
| Population | 2000 | 2010 | 2023 | 2028 |
|---|---|---|---|---|
| Households | 3,552 | 5,897 | 7,779 | 8,203 |
| Housing Units | 3,696 | 6,187 | 8,084 | 8,492 |
| Owner Occupied Units | 5,757 | 6,221 | ||
| Renter Occupied Units | 2,022 | 1,982 | ||
| Vacant Units | 305 | 289 |
Source: ESRI, 2023-10-17
Home Value
| Battle Ground, WA | 2023 | 2028 |
|---|---|---|
| Median Home Value | $443,407 | $514,611 |
| Average Home Value | $481,101 | $618,763 |
| <$50,000 | 262 | 26 |
| $50,000 - $99,999 | 11 | 0 |
| $100,000 - $149,999 | 6 | 0 |
| $150,000 - $199,999 | 32 | 0 |
| $200,000 - $249,999 | 111 | 1 |
| $250,000 - $299,999 | 167 | 19 |
| $300,000 - $399,999 | 1,539 | 848 |
| $400,000 - $499,999 | 1,729 | 2,094 |
| $500,000 - $749,999 | 1,514 | 2,096 |
| $1,000,000 + | 92 | 364 |
Source: ESRI, 2023-10-17
Housing Year Built
| Year Range | Houses Built |
|---|---|
| 2010 or Later | 1,424 |
| 2000-2009 | 2,127 |
| 1990-1999 | 1,937 |
| 1980-1989 | 466 |
| 1970-1979 | 997 |
| 1960-1969 | 195 |
| 1950-1959 | 144 |
| 1940-1949 | 55 |
| 1939 or Before | 106 |
Source: ESRI, 2023-10-17
Back To TopIncome
Income
| Battle Ground, WA | 2023 | 2028 |
|---|---|---|
| Median Household | $88,002 | $101,119 |
| Average Household | $108,080 | $127,547 |
| Per Capita | $37,610 | $44,545 |
Source: ESRI, 2023-10-17
Household Income Base
| Battle Ground, WA | 2023 |
|---|---|
| <$15,000 | 578 |
| $15,000 - $24,999 | 247 |
| $25,000 - $34,999 | 332 |
| $35,000 - $49,999 | 536 |
| $50,000 - $74,999 | 1,265 |
| $75,000 - $99,999 | 1,545 |
| $100,000 - $149,999 | 1,918 |
| $150,000 - $199,999 | 757 |
| $200,000+ | 601 |
Source: ESRI, 2023-10-17
Back To TopEmployees
Commute
| Category | Commuters |
|---|---|
| Workers 16+ | 9,601 |
| In-County Residents | 6,827 |
| Out-of-County Residents | 471 |
| Drive Alone | 7,637 |
| Carpooled | 874 |
| Public Transport | 99 |
| Work at Home | 638 |
| Less than 5 minutes | 316 |
| 5-9 minutes | 1,086 |
| 10-14 minutes | 441 |
| 15-19 minutes | 611 |
| 20-24 minutes | 855 |
| 25-29 minutes | 959 |
| 30-34 minutes | 1,761 |
| 35-39 minutes | 467 |
| 40-44 minutes | 466 |
| 45-59 minutes | 1,180 |
| 60-89 minutes | 480 |
| 90+ minutes | 342 |
| Average Travel Time | 0 |
Source: ESRI, 2023-10-17
Source: ESRI, 2023-10-17
Employees by NAICS
| Category | Number |
|---|---|
| Total Employees | 6,697 |
| Agr/Forestry/Fish/Hunt | 31 |
| Mining | 0 |
| Utilities | 20 |
| Construction | 754 |
| Manufacturing | 227 |
| Wholesale Trade | 87 |
| Retail Trade | 1,284 |
| Motor Veh/Parts Dealers | 73 |
| Furn & Home Furnish Str | 29 |
| Electronics & Appl Store | 16 |
| Bldg Matl/Garden Equip | 58 |
| Food & Beverage Stores | 392 |
| Health/Pers Care Stores | 49 |
| Gasoline Stations | 14 |
| Clothing/Accessory Store | 308 |
| Sports/Hobby/Book/Music | 71 |
| General Merchandise Str | 274 |
| Misc Store Retailers | 0 |
| Nonstore Retailers | 0 |
| Transportation/Warehouse | 134 |
| Information | 73 |
| Finance & Insurance | 174 |
| Cntrl Bank/Crdt Intrmdtn | 125 |
| Sec/Cmdty Cntrct/Oth Inv | 21 |
| Insur/Funds/Trusts/Other | 28 |
| Real Estate/Rent/Leasing | 137 |
| Prof/Scientific/Tech Srv | 413 |
| Legal Services | 25 |
| Mgmt of Comp/Enterprises | 0 |
| Admin/Support/Waste Mgmt | 477 |
| Educational Services | 689 |
| HealthCare/Social Assist | 764 |
| Arts/Entertainment/Rec | 74 |
| Accommodation/Food Srvcs | 651 |
| Accommodation | 5 |
| Food Srv/Drinking Places | 646 |
| Other Srv excl Pub Admin | 455 |
| Auto Repair/Maintenance | 102 |
| Public Administration Emp | 223 |
Source: ESRI, 2023-10-17
Educational Attainment (25+)
| Battle Ground, WA | 2023 |
|---|---|
| Some High School | 449 |
| Graduated High School | 3,614 |
| Associates Degree | 1,753 |
| Bachelor's Degree | 2,581 |
| Graduate Degree | 1,367 |
Source: ESRI, 2023-10-17
Back To TopBusinesses
Businesses by NAICS
| Category | Number |
|---|---|
| Total Businesses | 644 |
| Agr/Forestry/Fish/Hunt Bus | 5 |
| Mining Bus | 0 |
| Utilities Bus | 1 |
| Construction Bus | 85 |
| Manufacturing Bus | 23 |
| Wholesale Trade Bus | 9 |
| Retail Trade Bus | 90 |
| Motor Veh/Parts Dealers Bus | 7 |
| Furn & Home Furnish Str Bus | 9 |
| Electronics & Appl Store Bus | 4 |
| Bldg Matl/Garden Equip Bus | 10 |
| Food & Beverage Stores Bus | 14 |
| Health/Pers Care Stores Bus | 9 |
| Gasoline Stations Bus | 3 |
| Clothing/Accessory Store Bus | 7 |
| Sports/Hobby/Book/Music Bus | 22 |
| General Merchandise Str Bus | 5 |
| Misc Store Retailers Bus | 0 |
| Nonstore Retailers Bus | 0 |
| Transportation/Warehouse Bus | 9 |
| Information Bus | 12 |
| Finance & Insurance Bus | 33 |
| Cntrl Bank/Crdt Intrmdtn Bus | 15 |
| Sec/Cmdty Cntrct/Oth Inv Bus | 10 |
| Insur/Funds/Trusts/Other Bus | 8 |
| Real Estate/Rent/Leasing Bus | 31 |
| Prof/Scientific/Tech Srv Bus | 45 |
| Legal Services Bus | 7 |
| Mgmt of Comp/Enterprises Bus | 0 |
| Admin/Support/Waste Mgmt Bus | 16 |
| Educational Services Bus | 16 |
| HealthCare/Social Assist Bus | 70 |
| Arts/Entertainment/Rec Bus | 12 |
| Accommodation/Food Srvcs Bus | 54 |
| Accommodation Bus | 1 |
| Food Srv/Drinking Places Bus | 53 |
| Other Srv excl Pub Admin Bus | 83 |
| Auto Repair/Maintenance Bus | 13 |
| Public Administration Bus | 13 |
Source: ESRI, 2023-10-17
Back To Top